
Projects
Take a look at key highlights from my portfolio — find the complete list on GitHub or contact me for deeper dives.
Nutrient Composition of Common Foods in Canada: Analyzing the Canadian Nutrient File
Tech Stack:

Interactive dietary tools leveraging the Canadian Nutrient File — a Tableau dashboard for in-depth nutrient comparisons and a Streamlit app featuring dynamic visualizations, clustering analytics, and an AI chatbot for personalized nutrition guidance. Presented at YYC DataCon 2025.
View on GitHubAF Risk Prediction Using ECG & EHR Data
Tech Stack:

An end-to-end pipeline and interactive app for forecasting new-onset atrial fibrillation using routinely collected 12-lead ECG signals and EHR data. The XGBoost model identifies high-risk patients, while the Streamlit interface and DeepSeek chatbot provide intuitive exploration and insights. Presented at Statistical Society of Canada Annual Meeting 2025.
View on StreamlitCredit Card Default
Tech Stack:

A predictive modelling project to forecast credit card defaults using demographic and financial data from 30,000 account holders — combining exploratory data analysis, visualization, and machine learning (regularized classifiers and XGBoost) for robust risk prediction.
View on GitHubEnhancing Bank's Personal Loan Approaches
Tech Stack:

A sequential neural network model predicting customer likelihood to accept personal loan offers — achieving 98% accuracy, 96% precision, and 87% recall — to drive targeted marketing strategies.
View on GitHubSleep-Apnea Severity Estimation from EEG Spectrograms via ResNet-18
Tech Stack:

An end-to-end deep learning pipeline that regresses continuous AHI from EEG spectrograms using a ResNet-18 backbone. With subject-stratified validation, it achieves an RMSE of 6.8 events/hour and a Pearson correlation coefficient of 0.76, delivering accurate severity rankings across the entire AHI range. The workflow combines robust preprocessing, transfer learning optimization, and scalable inference for real-time sleep apnea screening.
View on StreamlitData-Driven Department Optimization
Tech Stack:
A suite of data-driven solutions optimizing operations across HR, Marketing, Sales, Operations, and PR. Leveraging machine learning, deep learning, and advanced analytics to tackle departmental challenges — from predicting employee turnover with logistic regression and deep nets, to customer segmentation via K-Means and autoencoders, sales forecasting with Prophet, medical diagnostics with deep models, and PR sentiment analysis using Naive Bayes and logistic regression.
View on GitHubGDP & Population: 2024 Olympic Medals
Tech Stack:

An analysis of how GDP, population, and socio-economic indicators relate to medal performance at the 2024 Olympics — using correlation matrices, regression models, and clustering techniques to uncover key drivers of success.
View on GitHubBeWell360: Your Daily Holistic Wellness Log
In Progress

BeWell360 is a holistic wellness tracker that uses data science and analytics to transform daily logs — nutrition, fitness, sleep, body composition, professional development, and personal growth — into actionable insights for balanced living.
View on GitHubDatabase Chatbots
Tech Stack:

AI-powered agents for conversational interaction with relational data — transforming natural language prompts into SQL queries and insights for data-driven decision-making.
View on GitHubDesigning an Intelligent Agent for the Wumpus World
Tech Stack:

An intelligent Wumpus World agent that navigates a grid of hazards and searches for gold under uncertainty. It perceives environmental cues — breezes near pits and stenches near the Wumpus — applies logical inference to deduce safe paths, and balances exploration with caution to avoid fatal encounters, demonstrating key AI concepts such as decision-making under uncertainty, logical reasoning, and informed search strategies.
View on GitHubYT Channel Analytics
Tech Stack:

A Streamlit app for analyzing YouTube channel performance — tracking subscriber growth, views, watch hours, likes, comments, and shares to uncover engagement insights.
View on StreamlitWine Dataset Analysis
Tech Stack:

An exploratory analysis of red and white wine quality — examining the proportion of high-quality wines, identifying key differentiators (e.g., alcohol content, sulphur dioxide), and evaluating their impact on ratings.
View on GitHubUnlocking Superconductor Potential: Predicting Critical Temperatures with Multiple Regression
Tech Stack:
A multiple regression analysis to predict superconductors' critical temperature (Tc), identify the most impactful material features, and evaluate model performance.
View on GitHubLife Expectancy EDA: Key Influencing Factors
Tech Stack:

A focused exploratory analysis of life expectancy drivers — examining healthcare investment, vaccination coverage, and socio-economic indicators — and contrasting trends across developed and developing countries.
View on GitHubLinkedIn and Mental Health: UCalgary MDSA Students
Tech Stack:

An interactive dashboard examining how LinkedIn engagement influences the mental health of UCalgary MDSA students — developed from a carefully designed survey to test hypotheses such as whether exposure to peers' success posts heightens anxiety or whether supportive comments enhance job-search confidence. The dashboard presents trends in confidence, anxiety, and comparison behaviours using simplified versions of the original survey questions, which were more comprehensive and formally structured — for example, "How motivated or anxious do you feel after browsing LinkedIn?" and "How often do you compare your progress to others online?" Users can explore correlations, observe sentiment shifts, and filter results by gender, age range, student status, and program specialization to reveal demographic patterns and identify areas where targeted support may be most beneficial.
View on Tableau PublicLEGO Set Analysis: Patterns in Build Complexity, Price Points, and Themes
Tech Stack:
An interactive visualization of the LEGO universe, analyzing 4,385 sets to reveal trends in average pieces, prices, and themes across age ranges. Users can filter by theme group, specific theme, or target age range to examine how complexity and pricing vary across categories. Key metrics — including total sets, average piece count, and average price — enable comparisons between themes, identification of high-value categories, and detection of design and pricing trends over time. Designed for collectors, enthusiasts, and data analysts, it offers a clear and engaging way to explore LEGO's evolution through data.
View on GitHubArticles
Browse my data science articles for practical tips, project breakdowns, and industry analysis — more on Medium.
What's in Your Food? A Data-Driven Nutrient Analysis

This article explores the nutritional content of commonly consumed foods in Canada, emphasizing the importance of balanced diets for maintaining overall health. Using data from The Canadian Nutrient File by Health Canada, the analysis covers 12 key nutrients, compares nutrient densities, and evaluates protein-to-fat ratios across food categories. The dataset, refined through thorough preprocessing, enabled detailed insights into nutrient levels, highlighting nutrient-rich and nutrient-poor foods.
View articleAnalyzing 2024 Olympic Medals: The Role of GDP and Population
This article explores the relationship between a country's population size and GDP per capita and its success in the 2024 Olympic Games. By analyzing these variables, we aim to understand how they influence the total number of medals won by different countries. The article also involves clustering countries based on their Olympic performance and socioeconomic context, providing insights into patterns and trends affecting their athletic achievements. Through this analysis, we seek to uncover the extent to which economic and demographic factors contribute to Olympic success.
View articleUnderstanding the P-Value in Hypothesis Testing
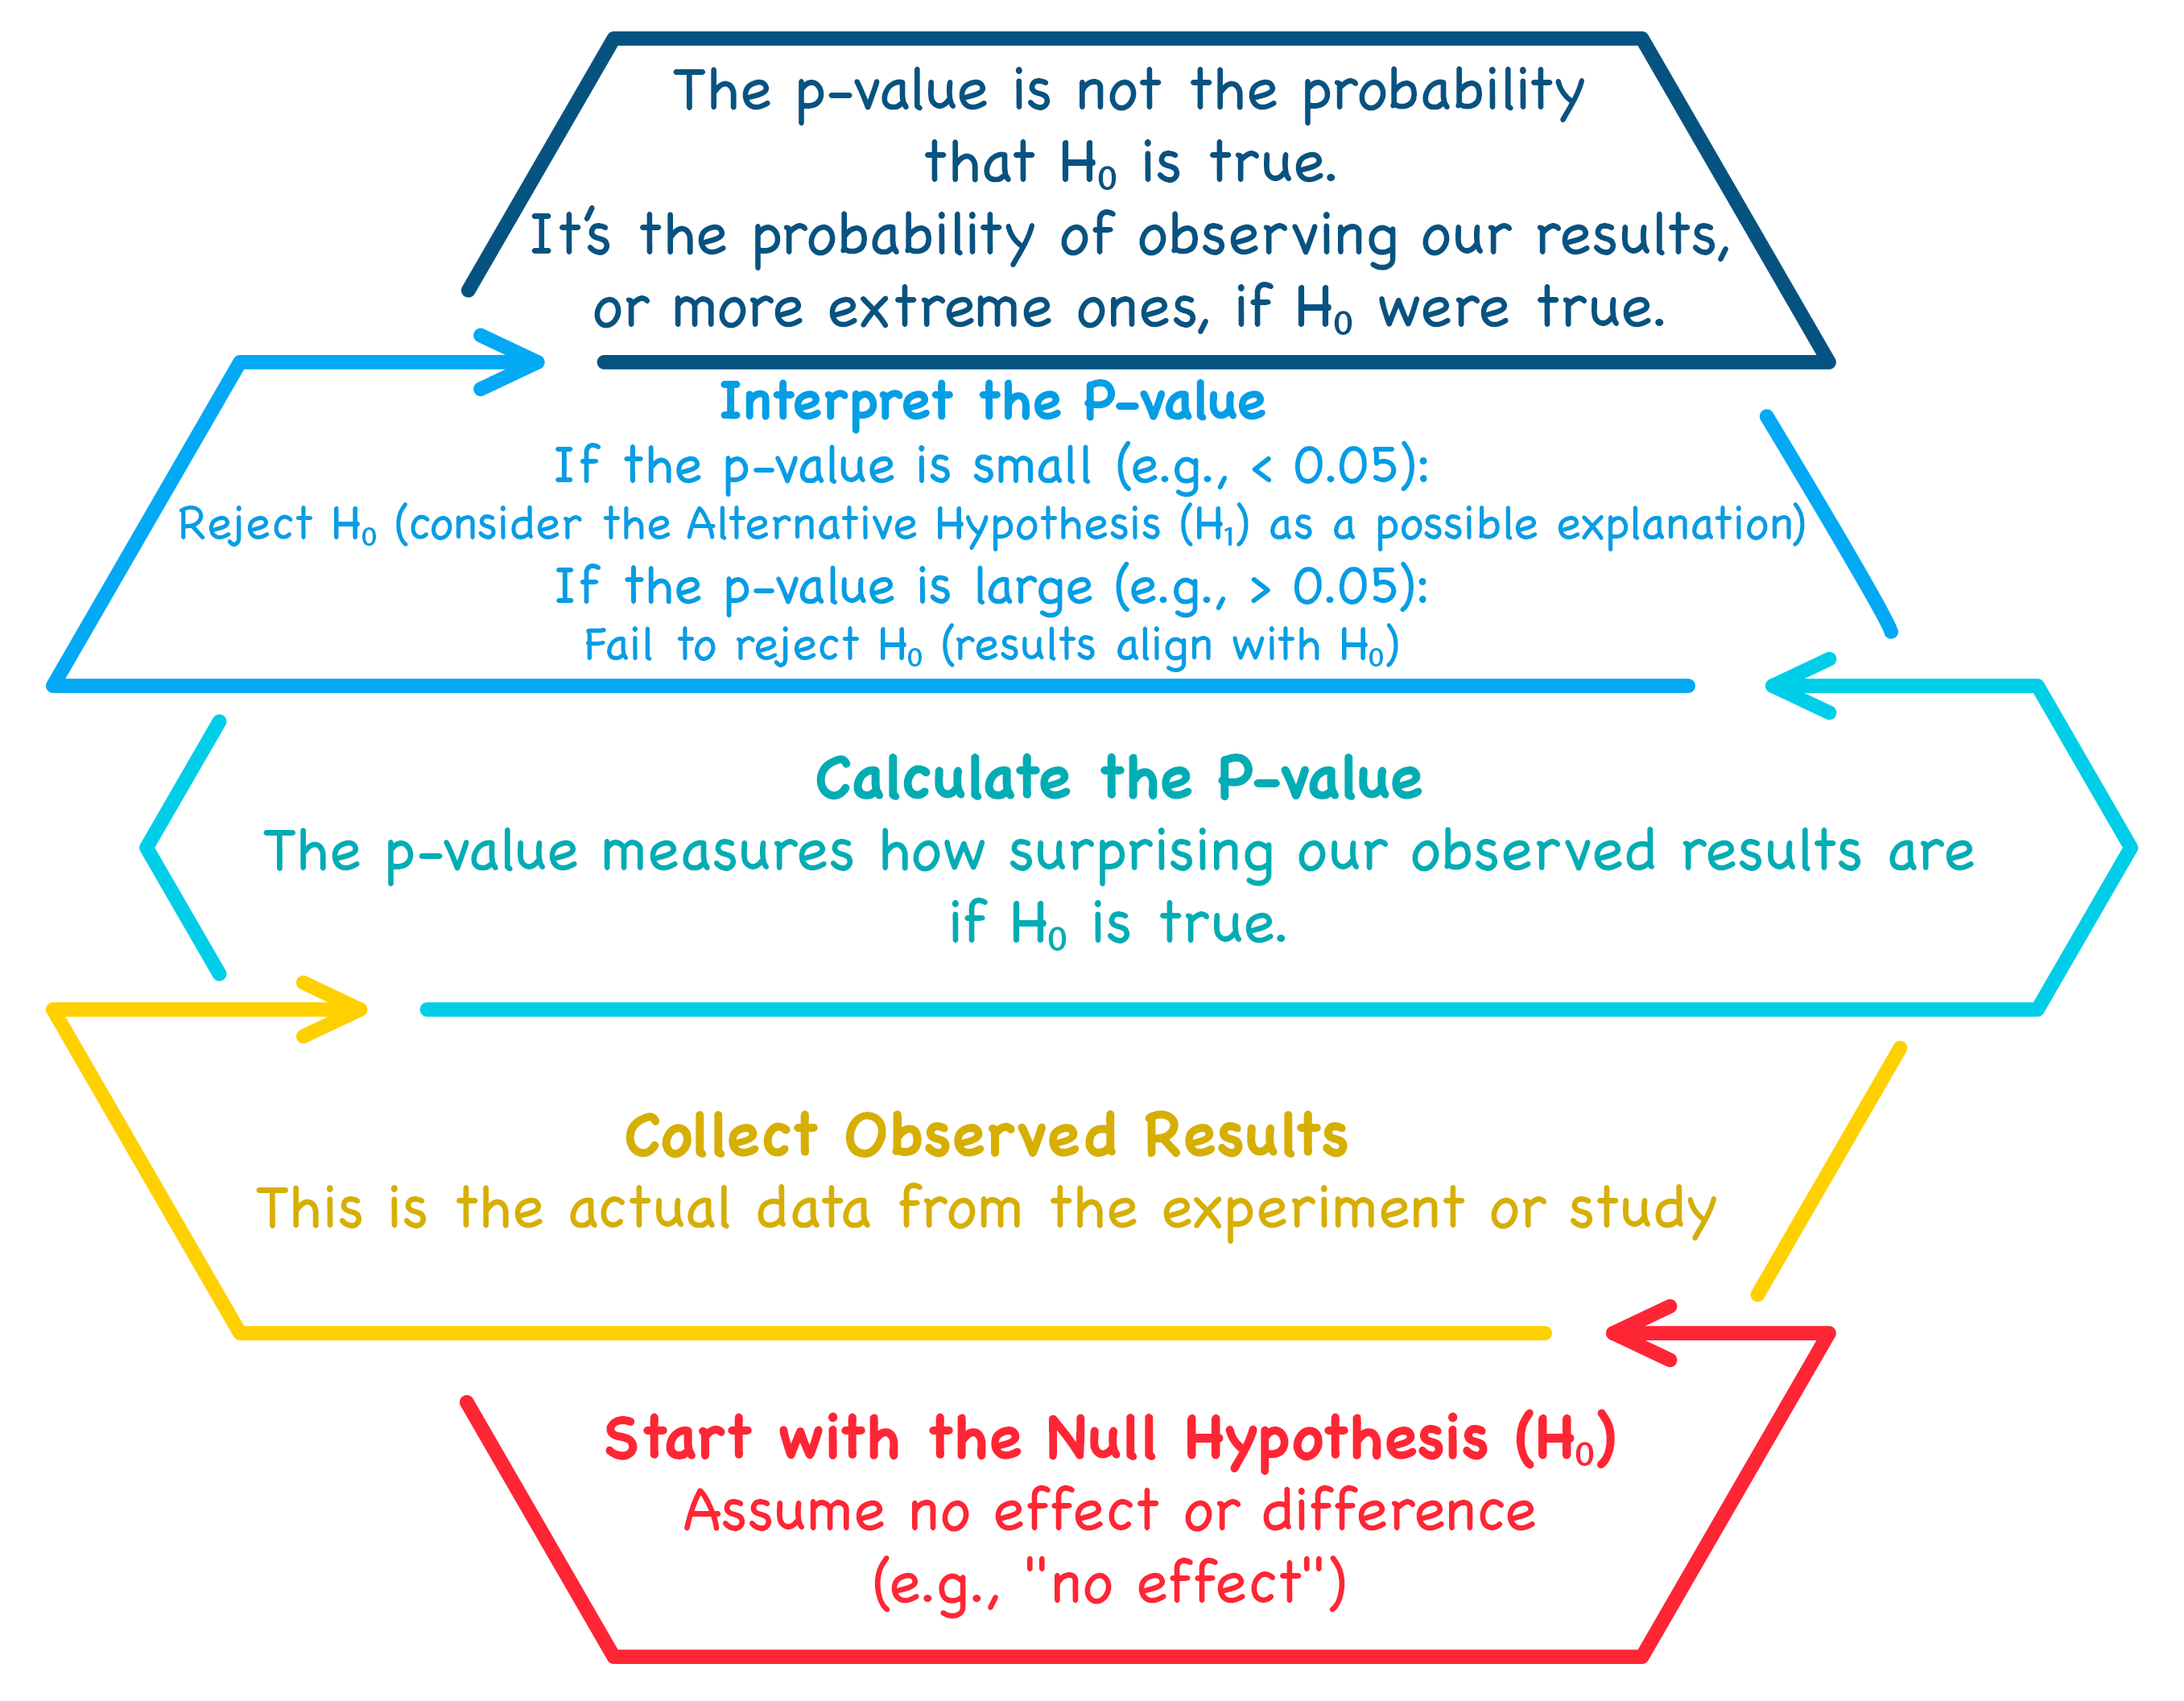
In hypothesis testing, we start with the null hypothesis (H0), assuming no effect or difference. We then collect our observed results — the actual data from the study — and calculate the p-value, which tells us how surprising these results are if H0 is true. A small p-value (e.g., < 0.05) leads us to reject H0, considering the alternative hypothesis (H1) as a possible explanation. A large p-value suggests our results align with H0, so we fail to reject it. Importantly, the p-value is not the probability that H0 is true; instead, it's the probability of observing our results, or more extreme ones, under the assumption that H0 is correct.
View articleEssential DAX Functions for Power BI: The Story Behind the Code

This article is a clear, practical guide to DAX in Power BI, focusing on understanding what you want to calculate rather than memorizing formulas. It explains how to choose between measures and calculated columns, how row and filter context work, and how to use key functions for totals, logic, and time-based calculations. With simple examples of CALCULATE, SUMX, IF, SWITCH, and more, it also covers text formatting, selection tools, and ways to filter or rank data. Tips on using VAR/RETURN help make formulas easier to read and faster to run, encouraging you to see DAX as both a language and a tool for building powerful reports.
View articleAbout
I am a data science and analytics specialist with experience building end-to-end data workflows, including ETL pipelines, automated dashboards, forecasting models, and machine learning solutions. I focus on delivering actionable insights that support strategic decisions across finance, government, healthcare, and technology.
-
Summary of Skills
Programming & Data Analysis
Python (pandas, NumPy), SQL, data wrangling, data quality validation, exploratory analysis, feature engineering, statistical testing and inference, KPI development, financial data analysis
Data Visualization & BI Platforms
Power BI, Power Automate, Tableau, D3.js, Matplotlib, Seaborn, report development, dashboard design, workflow automation, financial dashboards, executive scorecards
Machine Learning & Deep Learning
scikit-learn, XGBoost, LightGBM, Prophet, TensorFlow, Keras, PyTorch, model development and validation, cross-validation, hyperparameter tuning, ensemble methods, forecasting, anomaly and risk detection models
MLOps & Cloud Infrastructure
AWS S3, AWS SageMaker, Streamlit, Git, model deployment and tuning, rapid UI prototyping for ML workflows, version control
-
Employment Experience
Analyst, Business Intelligence & Data Analytics, Jan 2026–Present
Government of Alberta, Edmonton, AlbertaData Scientist & Co-Founder, Oct 2025–Present
SnowyOwl Data, Edmonton, Alberta
• Created an automated PDF invoice extraction system that transforms unstructured invoices into analysis-ready Excel datasets, reducing manual data entry and improving reporting accuracy.
• Leading the development of BeWell360, a holistic wellness tracker that applies data science and analytics to transform daily logs, including nutrition, fitness, sleep, body composition, professional development, and personal growth, into actionable insights for balanced living.Data Science Analyst, May 2025–Jan 2026
BGE Indoor Air Quality Solutions, Edmonton, Alberta
• Developed Power BI dashboards and reports for the finance department, integrating data from multiple sources and applying advanced DAX calculations to enable cross-functional reporting and support data-driven leadership decisions.
• Automated data generation, extraction, and transformation using Power Automate, feeding dashboards for real-time financial analysis and actionable insights.
• Published, scheduled, and maintained reports in shared Power BI workspaces, enabling timely insights and effective teamwork across departments.
• Created a standardized Power BI JSON theme to accelerate development and maintain visual consistency across reports and dashboards.
• Received the Be the Expert Award (2025) for excellence in data-driven reporting through developing Power BI dashboards, automating workflows, and standardizing reporting for efficiency and consistency.Research Assistant, Machine Learning, May 2025–Jul 2025
University of Calgary, Calgary, Alberta
• Engineered end-to-end data preprocessing workflows in Python, transforming raw EEG signals into structured features via windowing, normalization, artifact rejection, and spectrogram generation.
• Leveraged transfer learning with a pre-trained ResNet-18 model, applying cross-validation, learning-rate scheduling, early stopping, and data augmentation to train a continuous AHI regression model.
• Validated model performance on held-out subjects, delivering accurate predictions and actionable insights for analytics.Web Publisher, Data Visualization, Sep 2020–Aug 2024
Health Canada, Ottawa, Ontario
• Developed custom AEM components using D3.js to ingest Health Canada datasets and render interactive charts and tables, enabling dynamic data exploration and actionable insights.
• Built and maintained WCAG 2.1 AA-compliant pages on Canada.ca in Adobe Experience Manager, ensuring accessible and user-friendly presentation of data-rich content.
• Recognized with two Assistant Deputy Ministers' Merit Awards (2023) for Collaboration and Service Excellence and for Contribution to the Improvement of the Health of Canadians.Web Developer, Programming & Data Analysis, Mar 2019–Sep 2019
OPIN, A Portage CyberTech Company, Ottawa, Ontario
• Developed Power BI dashboards from web-traffic exports to track monthly usage patterns and top pages, supporting data-driven marketing and UX decisions.
• Built and maintained WCAG 2.1 AA-compliant Drupal websites for clients, including Holland Bloorview, Hydro Ottawa, and York Region DSB, improving usability and accessibility.
• Refactored and documented HTML, CSS, JavaScript, and PHP codebases, enhancing site performance, maintainability, and scalability.Doctoral Researcher, Data Analysis & Visualization, Nov 2013–Mar 2016
National Academy of Sciences of Ukraine, Kyiv, Ukraine
• Collected, validated, and structured experimental datasets for statistical modelling, applying rigorous data-quality checks to ensure accuracy and consistency.
• Produced analytical reports and data visualizations that informed research outcomes and supported peer-reviewed publications and patented innovations.
• Presented findings at international conferences, translating complex analyses into clear insights for technical and non-technical audiences. -
Education
Master of Data Science and Analytics (Honours), 2025
University of Calgary, Calgary, AlbertaCertificate in Artificial Intelligence, 2024
University of Toronto School of Continuing Studies, Toronto, OntarioCertificate in Data Science, 2022
University of Toronto School of Continuing Studies, Toronto, OntarioOntario College Diploma (Honours) in Internet Applications and Web Development, 2019
Algonquin College of Applied Arts and Technology, Ottawa, Ontario -
Certifications
Microsoft Certified: Power BI Data Analyst Associate, Microsoft, 2025
Investment Foundations Certificate, CFA Institute, 2025
Contact
If you have any questions or would like to connect, feel free to reach out:
+1 613 700 4510